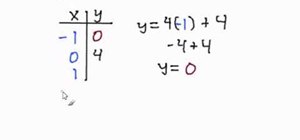
In this video the author shows how to graph using an X-Y table. He shows how to do this with a sample equation. He builds a table of x, y values where he takes sample values for x like -1, 0, 1 and now he substitutes these values in the equation of the line and obtains the corresponding y values. Now finally he has an x, y value table which now he shows how to plot it on a coordinate plane. He plots all the three pairs on the graph and connects them with a line finally obtaining the resultant line of the equation. This video clearly shows with an example, how to graph an equation using an X-Y table.
Just updated your iPhone to iOS 18? You'll find a ton of hot new features for some of your most-used Apple apps. Dive in and see for yourself:










Be the First to Comment
Share Your Thoughts