

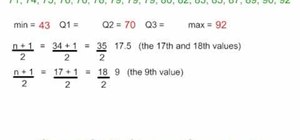
This is an interesting mathematical instructional video on how to make a quartile diagram. This example is about 34 grades obtained by chemistry class students. We need a minimum value, a maximum value, Q1, Q2 and Q3 values to make a quartile diagram. The minimum is 43 and the maximum is 92. To calculate Q2 median formula (n+1 over 2)is used. The Q2 median is 17.5. So the average of 69 and 71 is 70 and hence Q2 70. Similarly Q1 is calculated as 61 and Q3 is calculated as 79. Now you can draw the quartile diagram.
Just updated your iPhone? You'll find new emoji, enhanced security, podcast transcripts, Apple Cash virtual numbers, and other useful features. There are even new additions hidden within Safari. Find out what's new and changed on your iPhone with the iOS 17.4 update.


Be the First to Comment
Share Your Thoughts