

Need to know how to use your Texas Instruments graphing calculator for your college math or statistics class? You're in luck... watch this video tutorial to see how to create a histogram with a TI-83 graphing calculator.
Creating a histogram from grouped data.
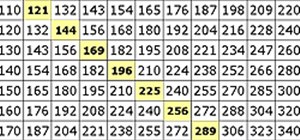
Consider the frequency table of the number of runs scored by the 1996 New York Yankees.
Create a histogram of the data located in the frequency table shown in the video. NOTE: Class Marks are also called Class Midpoints.
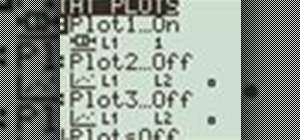
Create a histogram with a TI-83 graphing calculator
 Click through to watch this video on ccbcmd.edu
Just updated your iPhone? You'll find new emoji, enhanced security, podcast transcripts, Apple Cash virtual numbers, and other useful features. There are even new additions hidden within Safari. Find out what's new and changed on your iPhone with the iOS 17.4 update.


Be the First to Comment
Share Your Thoughts