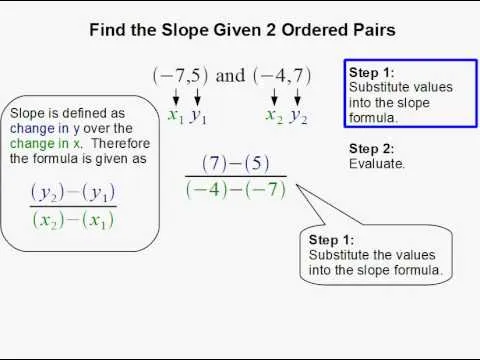
If you want to learn how to get and graph the slope of a line using two points, you should watch this. 1. Let your two points be (x1 , y1) and (x2 , y2). Draw a straight line that connects the two points. 2. Use the formula, m = change in y over change in x , for finding the slope which is represented by the variable m. 3. The simpler form of the formula would be m = (y1 - y2) / (x1 - x2). 4. If you were given two points, just substitute the values in the given formula. 5. For example, the two points are (5, -2) and (2, 4). So by substitution, m = (-2-4)/(5-2) = -6/3 = -2. Thus m= -2. 6. If the slope is negative, it means as the line moves to the right, the line also moves down. After following these simple steps, expect that you can get a near to perfect, if not perfect, score in getting and graphing the slope of a line using two points test.
Apple's iOS 26 and iPadOS 26 updates are packed with new features, and you can try them before almost everyone else. First, check Gadget Hacks' list of supported iPhone and iPad models, then follow the step-by-step guide to install the iOS/iPadOS 26 beta — no paid developer account required.








Comments
Be the first, drop a comment!