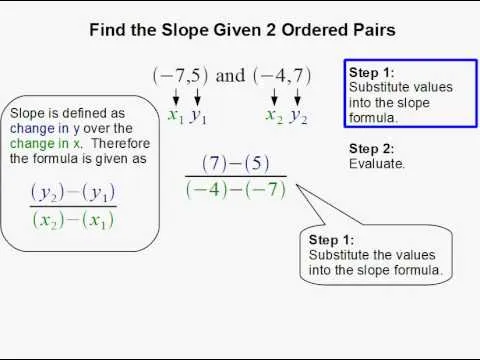
In this video tutorial, viewers learn how to graph a linear equation. The linear equations example used in this video is y= 1/3x-3. The equation to graph a linear equation is y= mx+b. Now substitute each number into the equation. Therefore, m= 1/3 and b= -3. Begin by graphing the Y-intercept. M is the slope and b is the y-intercept. Plot the y-intercept on the -3 axis. Then move up once and to the side 3 times. This video will benefit those viewers who are struggling with this math unit and are in need of extra help.
Apple's iOS 26 and iPadOS 26 updates are packed with new features, and you can try them before almost everyone else. First, check Gadget Hacks' list of supported iPhone and iPad models, then follow the step-by-step guide to install the iOS/iPadOS 26 beta — no paid developer account required.











Comments
Be the first, drop a comment!