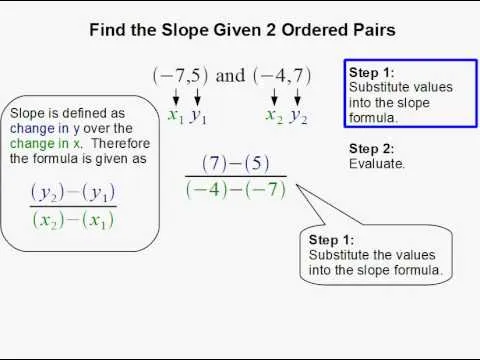
Given a point through which a line passes and the value of its slope you can graph the line. To do this first plot the given line. Now taking the slope and using the rise over run method plot a second point. Connect these two points and this gives you the graph of the line. Extend this line further on both sides to get the complete line. The point where this line cuts the x-axes is called the x-intercept and the point where this line cuts the y-axes is called the y-intercept. The important point to remember is that slope is rise over run and how to use it to plot a new point from the given point. This video shows how to graph a line using a point and slope of it.
Apple's iOS 26 and iPadOS 26 updates are packed with new features, and you can try them before almost everyone else. First, check Gadget Hacks' list of supported iPhone and iPad models, then follow the step-by-step guide to install the iOS/iPadOS 26 beta — no paid developer account required.










Comments
Be the first, drop a comment!