

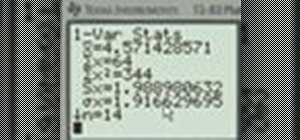
Need to know how to use your Texas Instruments graphing calculator for your college math or statistics class? You're in luck... watch this video tutorial to see how to measure dispersion with a TI-83 graphing calculator.
Measures of central tendency and dispersion.
Determine the mean, median, standard deviation, sample size and 5-number summary for the list of numbers: {4, 5, 4, 5, 9, 5, 7, 4, 3, 2, 5, 6, 4, 1}. This list of data are the baseball scores from Saturday, July 4, 1998 according to USAToday.
Note: The TI-83 will not give you the MODE. To find the mode, enter the data into the TI and sort the list. Then manually count which data value occurs most often.
Measure dispersion with a TI-83 graphing calculator
 Click through to watch this video on ccbcmd.edu
Just updated your iPhone? You'll find new emoji, enhanced security, podcast transcripts, Apple Cash virtual numbers, and other useful features. There are even new additions hidden within Safari. Find out what's new and changed on your iPhone with the iOS 17.4 update.


Be the First to Comment
Share Your Thoughts