

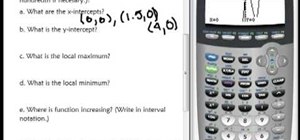
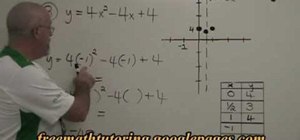
In this video the teacher shows us how to use a TI-84 plus graphing calculator to graph a function, adjust the view window, and determine the values of several types of critical points on the graph such as x-intercept, y-intercept, local maximums, and local minimums. After entering the function in the Y= editor she presses the ZOOM button and selects Z-Standard this adjusts the view window to a range of -10 to 10 on both axis. To find each of the critical points requested the teacher uses the CALC menu by pressing 2nd then CALC then selects the appropriate menu option. Once the option is selected she shows how you must move the cursor to both the left and right of the critical point pressing ENTER after each input. This procedure does not work for finding the y-intercept, to do this she uses "value" in the CALC menu and enters X=0 to determine the y-value. The teacher then uses the information she gathered about local maximums and minimums to record where the function is increasing and decreasing, this is done by looking at the shape of the graph and using the x-values determined for the local maximums and minimums.
Just updated your iPhone? You'll find new emoji, enhanced security, podcast transcripts, Apple Cash virtual numbers, and other useful features. There are even new additions hidden within Safari. Find out what's new and changed on your iPhone with the iOS 17.4 update.


Be the First to Comment
Share Your Thoughts