


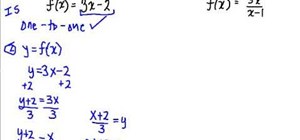
In this video tutorial learn how to graph an equation using the slope and y-intercept. To show how this can be done, the equation 4X-5Y=20 is used as an example. The first step that needs to be done is to convert the equation into the y=mx+b format where m is the slope and b is the intersection of the y-intercept. Simply solve the equation for Y and you get Y=4/5X-4. From this, you will find that the slope, or m, is equal to 4/5 and that b is the coordinates 0 and -4. On the graph, you will want to plot the 0, -4 coordinates. Then plot the slope, 4/5. To do this, the slope would obviously be a negative or a positive. Plot both points and you will have made your line on the graph. Follow the steps outlined in this video tutorial to learn how to graph a linear equation by identifying the slope and Y-intercept.
Just updated your iPhone? You'll find new emoji, enhanced security, podcast transcripts, Apple Cash virtual numbers, and other useful features. There are even new additions hidden within Safari. Find out what's new and changed on your iPhone with the iOS 17.4 update.


Be the First to Comment
Share Your Thoughts